In May of 2018 a door to door solar energy salesman talked with me as I was working on the front lawn. He talked about federal, state and local incentives for solar panels and explained I had a wonderful location for solar collection. I did not commit but the conversation advanced something we had always intended to do – install solar panels. A few factors had piqued our interest…
How Much Does Solar Generation Cost – Per Watt?
We kept hearing about astounding advances in solar collection technology. The cost to generate electricity with solar had dropped by a factor of 300 over the last 40 years, as pictured here:
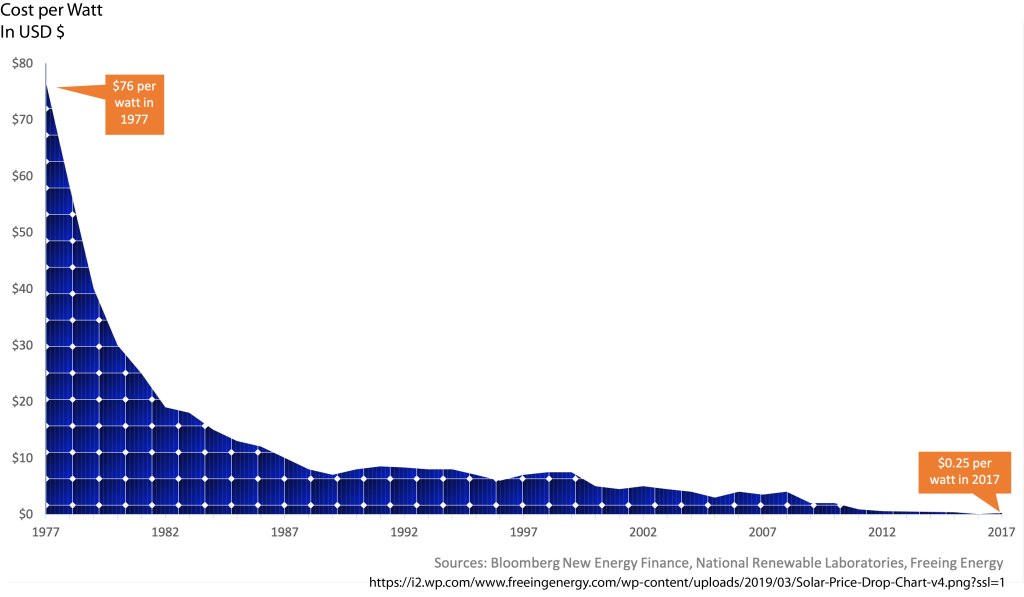
Consumer Reports was actively encouraging solar. In their words, “….A lot has changed in the intervening 37 years: Solar costs have dropped so much that today it’s possible to generate all or most of a home’s electricity—for decades to come—for about the purchase price of a new economy car. Solar installations have increased dramatically. …There has probably never been a better time to switch to solar.”
If you are wondering how such a dramatic drop in solar cost per watt occurred over the last decades, MIT studied that question . They found that a combination of factors — much higher “conversion” (changing sunlight to electricity) efficiency, economies of scale, research and development, governmental support policies etc. — brought this about. Read the full study here.
So we asked…
Can I Generate AND Tie into My Electric Utility?
Most suprising to us, our electricity provider, small and local Hingham Municipal Light and Power (HMLP), actively encourages residential solar. It provides a “net metering” option which allows for the homeowner to “sell” excess daylight energy back to the “grid” / the utility and tap into the grid for nightly use of electricity when the panels are not generating. The net meter works as pictured below.

Source: Ohio Environmental Council
So that would work for us. We also wondered…
How Much Less Carbon Would We Add To The Atmosphere?
The carbon added to the atmosphere for each unit of generated electricity varies by region. The Environmental Protection Agency calculates that generation in our region, New England (NEWE), spews out 728 Pounds of Carbon for every 1,000 kilowatt-hours (KWh) of electricity delivered. (That is less than half of what the Midwest (SERC Midwest) generators spew — 1,820 Pounds per 1,000 KWh).
According to the U.S Energy Information Administration (EIA), in 2019 the average U.S. residential utility customer consumed 10,649 kilowatthours (KWh) per year. Our residence only used about 5,800 kWh in electricity per year. Even at that lower usage rate (and using the New England figures) we caused almost 7,000 pounds of carbon to go into the air to get this much electricity! Solar panels would reduce this 7,000 pounds to just about zero as depicted below. [Note that we still use natural gas for heating and cooking and we include that carbon emissions level, 15,000 pounds, on the chart.]
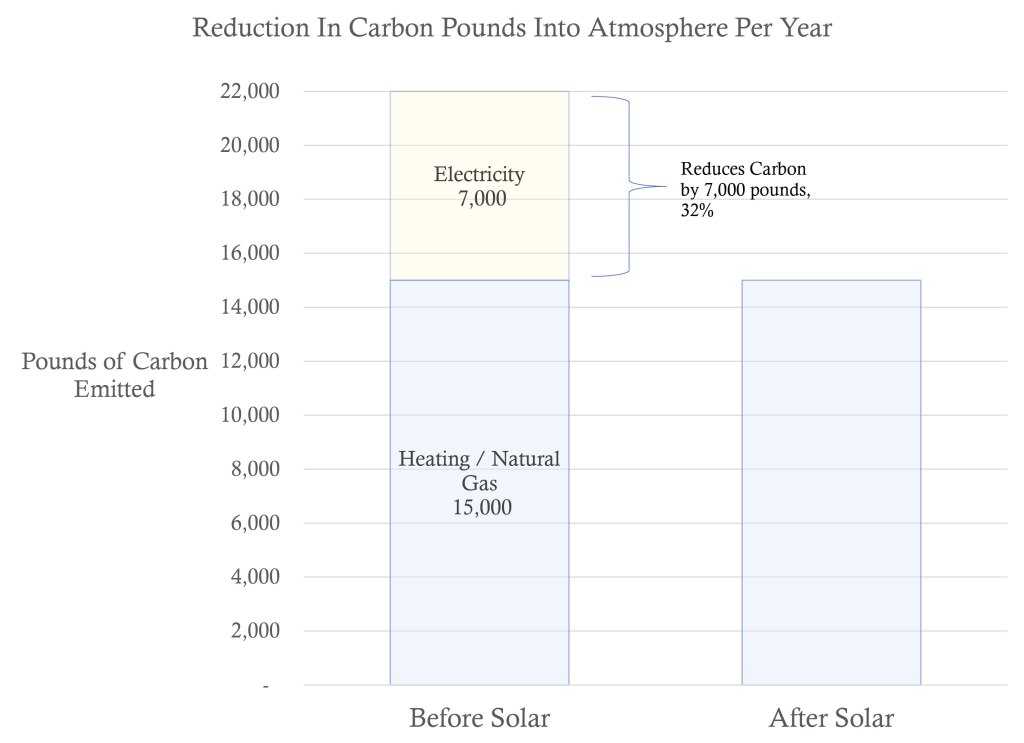
Going solar would reduce our residential carbon footprint by 32%. (We still need to work on gas heating!)
But we also wondered…
Could Panels on Our Roof Cover All Our Electric Usage?
From Consumer Reports, “… A solar electric system … usually costs $15,000 to $20,000 after tax credits and can reduce your electricity bill by 70 to 100 percent, depending on the size and orientation of your roof and local regulations. Most systems pay for themselves in five to seven years.”
Could a solar panel system generate the approximately 5,800 KWh we used annually? We needed to understand how much electric energy, panels on our roof could produce given the shading, angles of roof, space available, etc. It all sounded very promising and beneficial for us and the environment so we began to look at installing in earnest. The first step involved getting a site feasibility assessment and, if the site was viable, if it could match our needs and if viable then a project plan and price.
Who Ya Gonna Call?
We believe in the J Edwards Deming and Total Quality Management (TQM) approach of selecting and staying with a “sole source supplier” Picking one supplier whom we could rely on for the highest quality in products and installation had worked for us on other home projects. So we eschewed the usual “three competing bids and business goes to the lowest bidder” approach. Instead we looked for someone who had installed a lot of solar in the south shore of Massachusetts and had established a reputation for quality. I went to Hingham Municipal Power and Light employees and asked — off the record! — whom they worked a lot with and could recommend. They generously filled me in –off the record — and we called My Generation Energy of Hyannis, MA.
My Generation Energy scheduled a field visit from one of their project leaders, Josh Buck. Josh’s visit focused on feasibility. Does our roof offer enough available area for the panels? Is the roof in shade or exposed to sunlight and how much? Does the roof tilt towards and face the sun (i.e. face east or south or west, vs. facing north)? The roof needed to pass all these tests to score enough Total Solar Resource Fraction (TSRF), a percentage estimate of the combined effect of shading, tilt and orientation on a system’s performance, to qualify for rebates and offers.
This video describing the Solmetric SunEye — a device for measuring shading, tilt, orientation etc. — captures what Josh did on our roof to assess feasibility:
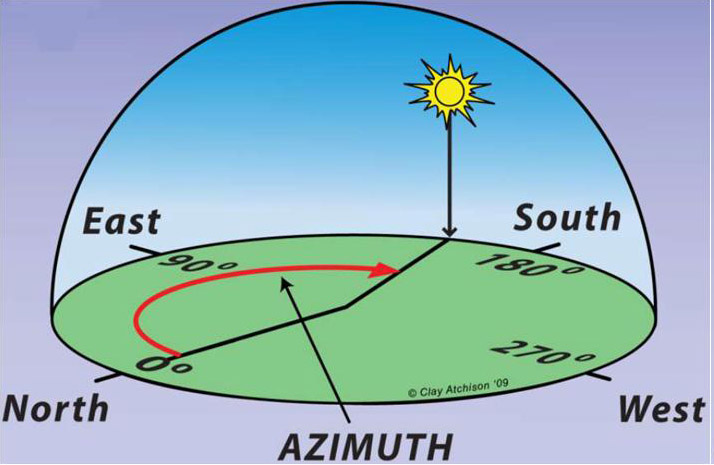
To qualify for rebates in Massachusetts, the proposed mounting area needed to have openness to sunlight (freedom from shade) for at least 80% of the total possible sunlight all year. The azimuth (see explanation below) of the roof section housing the panels needed to point in any direction but north, namely it’s azimuth must fit between 90° (straight east) and 270° (straight west).
Josh thought it would work based on a site assessment. Since we had already cleared 4 large trees in the yard (see Trees Too Risky to Keep on this site) the roof got almost full sun. Another factor relates to the age of the shingling on the roof. Installers want to add panels only onto recently shingled “new” roofing to avoid the cost and expense of having to remove and return panels should the roof shingles need replacement soon after solar installation. We had done our multiple re-roofings in different phases over the year as pictured.
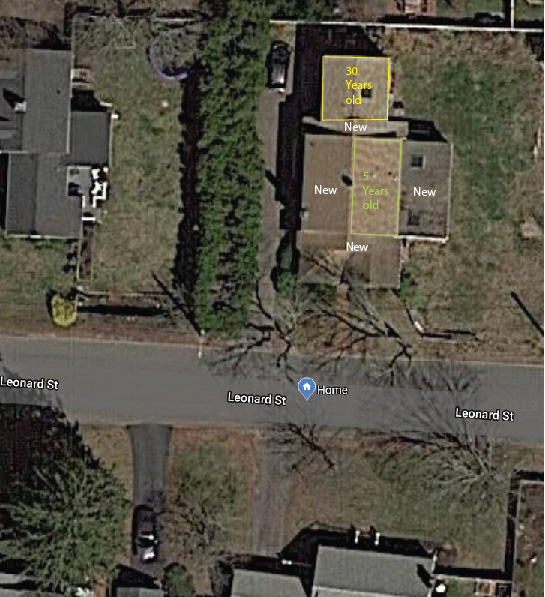
After assessing our annual usage, inspecting the site and evaluating the roof sections’ ages he suggested installing panels on the east side roof as pictured:
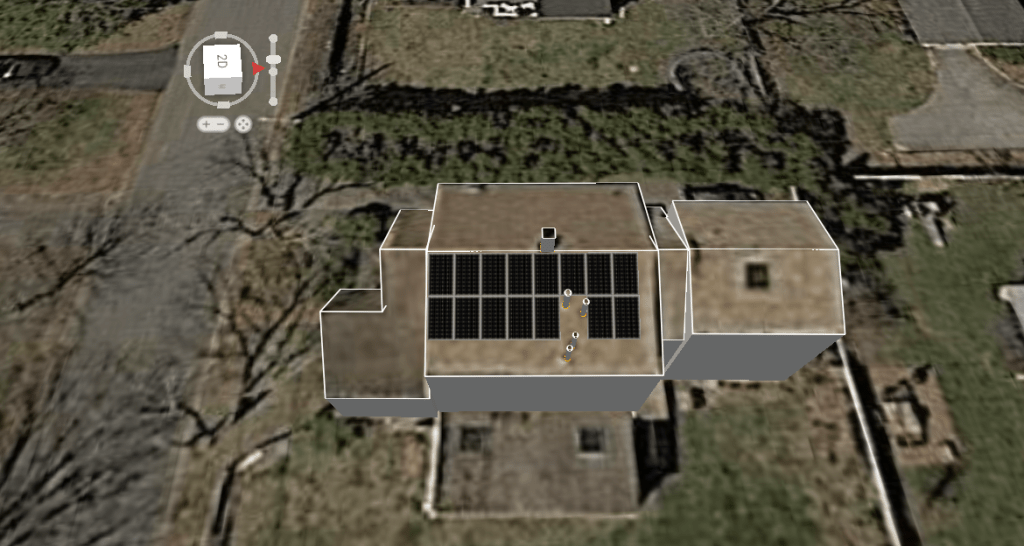
As it turns out the west roof faced a compass point or azimuth of 273º – just beyond the limit of 270 required for a $1,200 solar rebate. Josh recommended installing 15 panels — LG NeON 2 Solar Panels each of which could generate up to 335 watts of electricity at full production. Our roof position and shading left us at 84% performance factor – that is 84% of the total available sunlight gets through to the panels. The 15 panels would deliver, across a year of varying daylight hours and clear skies, our full 5,500 KWh’s. Yes. This solar installation could cover our annual needs. We felt good.
How Much Would It Cost?
For a fee of $17,839 My Generation Energy proposed to design, provision, and install a roof-mounted, grid-interconnected electrical solar photovoltaic array with 5.025 kW (DC STC) rated capacity. The components included:
- 15 Modules: LG 335w
- 15 “Micro” Inverters: Enphase IQ7
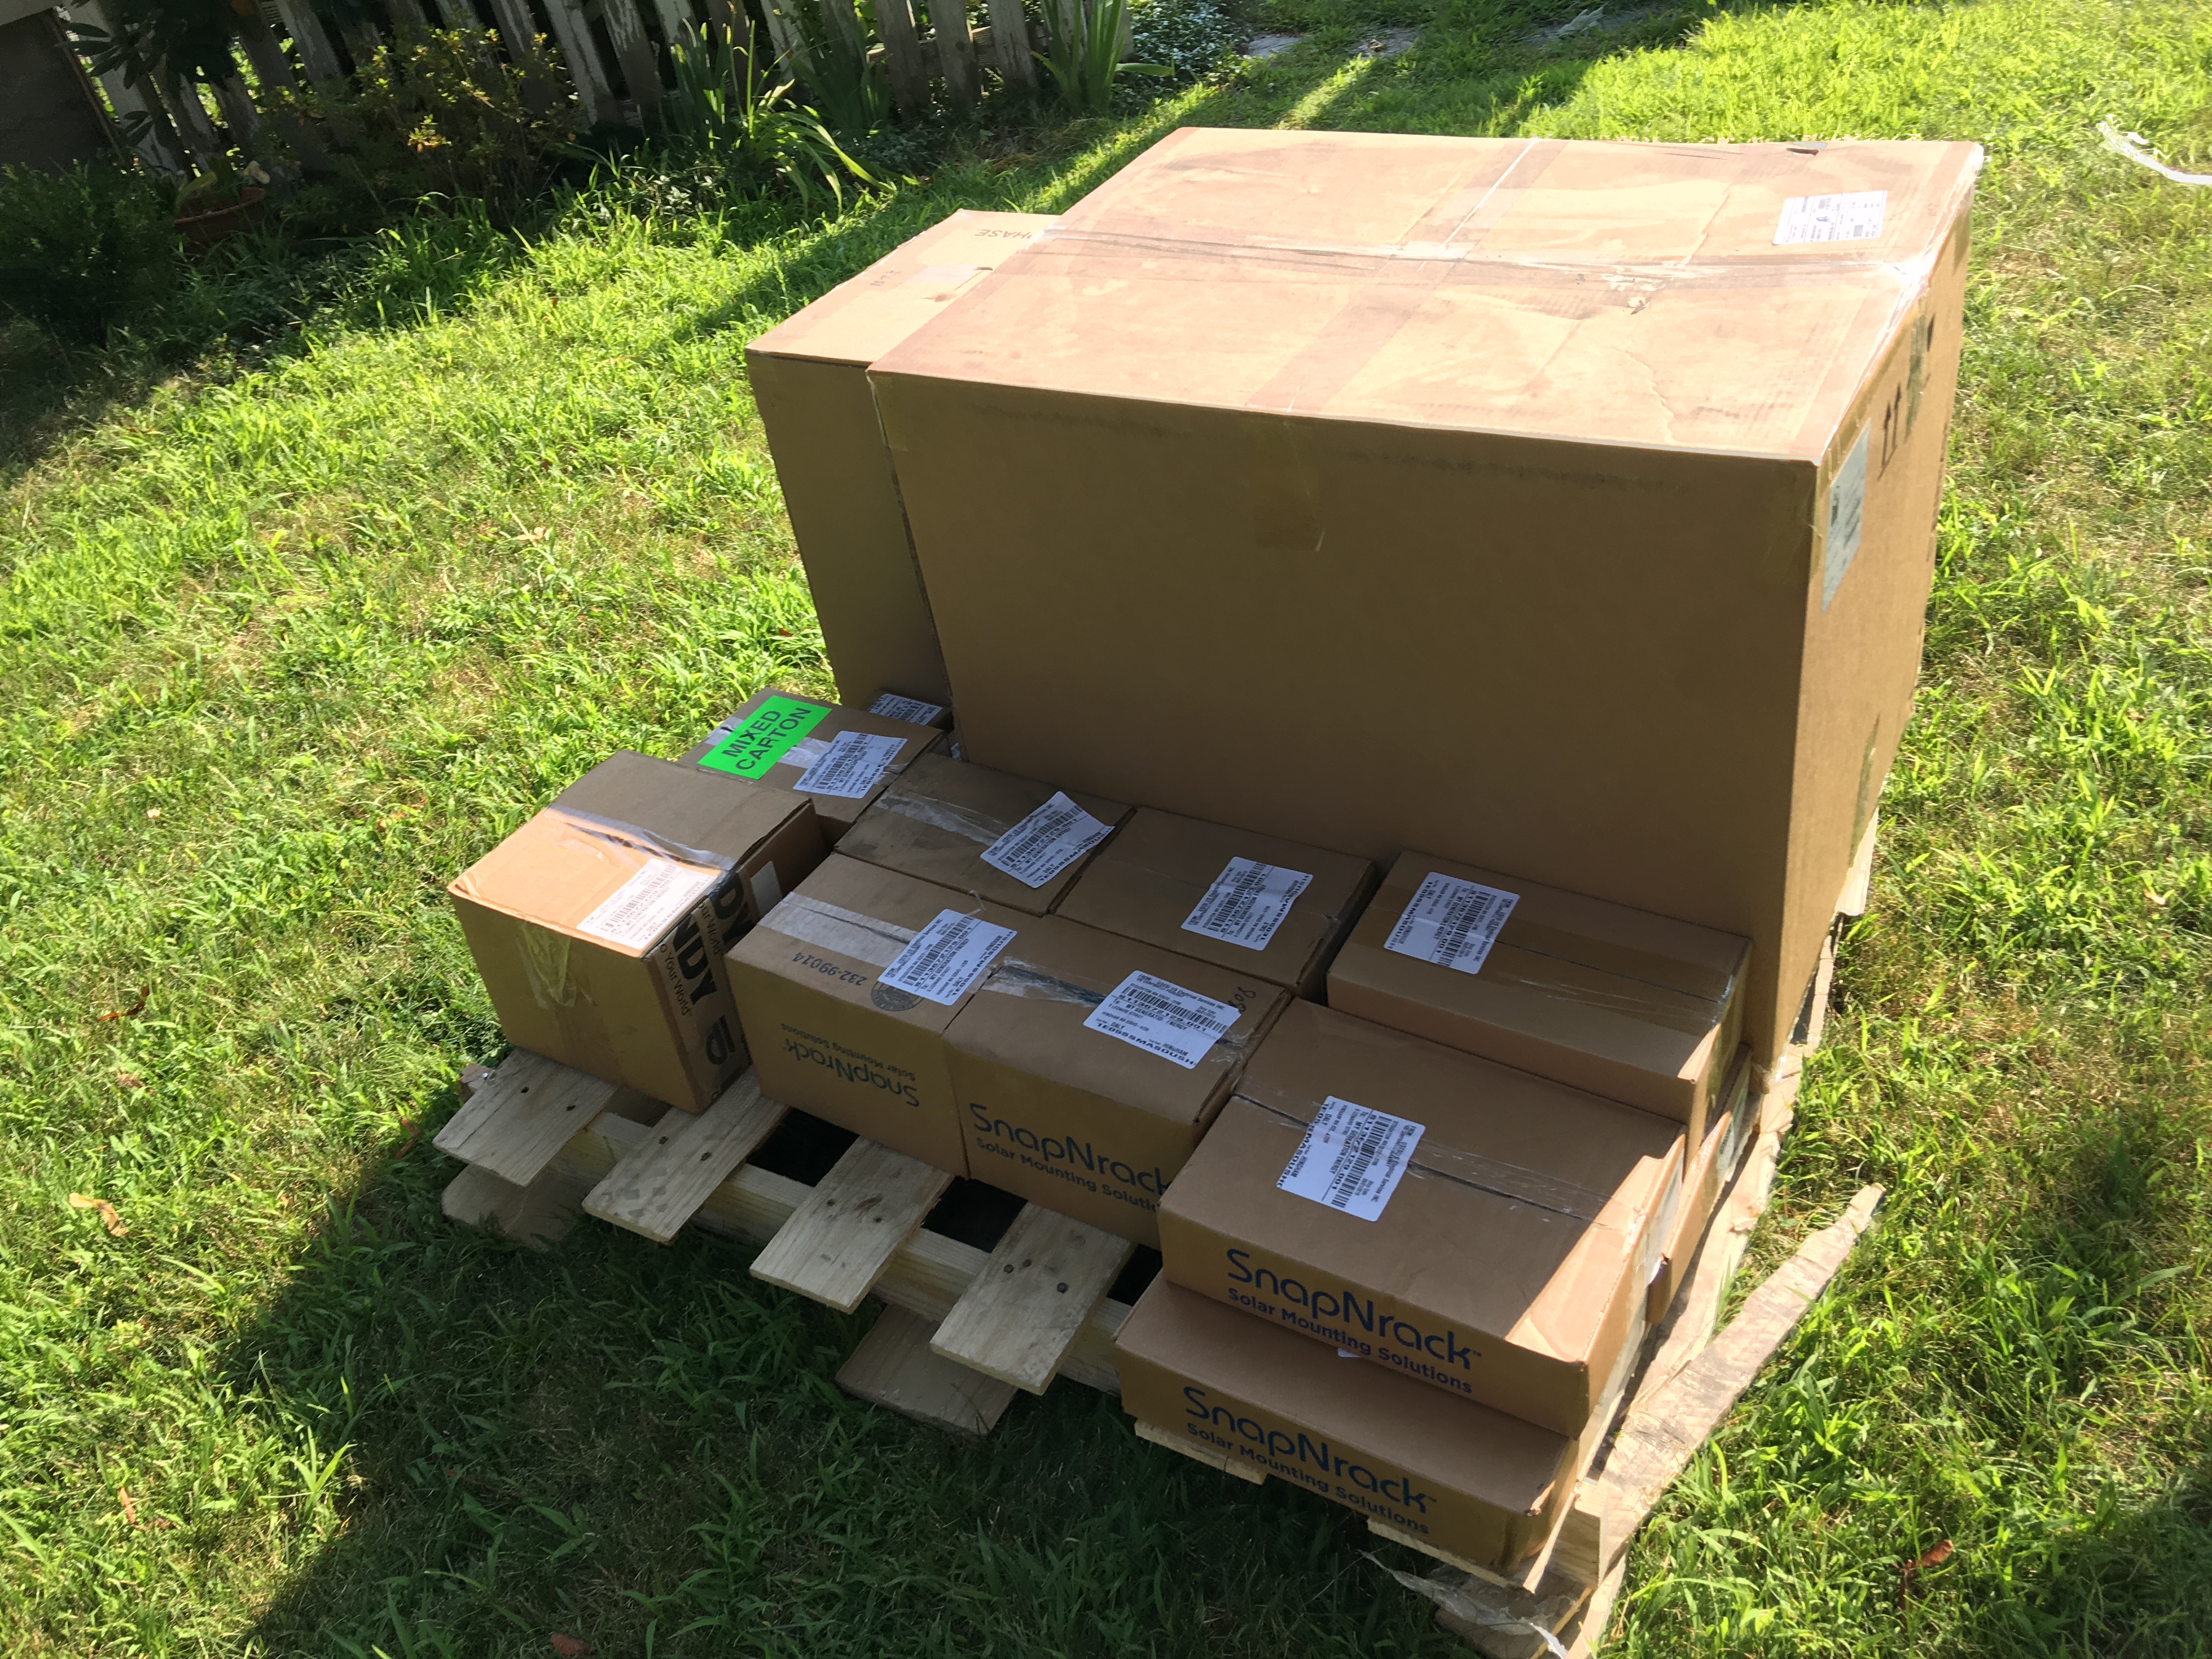
- Mounting Hardware: SnapNrac
This service included obtaining necessary building permits; application for electrical service interconnection; scheduling and participating in inspections, etc.
… After the Rebates and Credits?
Yes, the rebates and tax credits significantly reduced the cost:
- The Federal Income Tax Credits — 30% of system installed cost — delivered $5,351 for our system.
- The Commonwealth of Massachusetts Income Tax Credit paid $1000 (for primary residences).
- The Massachusetts Department of Energy Resources (DOER) provided a solar rebate of $3,000
- Hingham Municipal Light and Power (HMLP) provided a $5,000 bill credit to customers who install solar. That bill credit can be used to pay for any excess energy that you use from the grid.
These brought the cost considerably lower, $9,352 lower, 52% lower, to a post-rebates and credits cost of only $8,487. And the investment continued to pay monthly in freedom from electricity charges, i.e., free electricity.
What Was the Bottom Line $ Value of Installing Solar
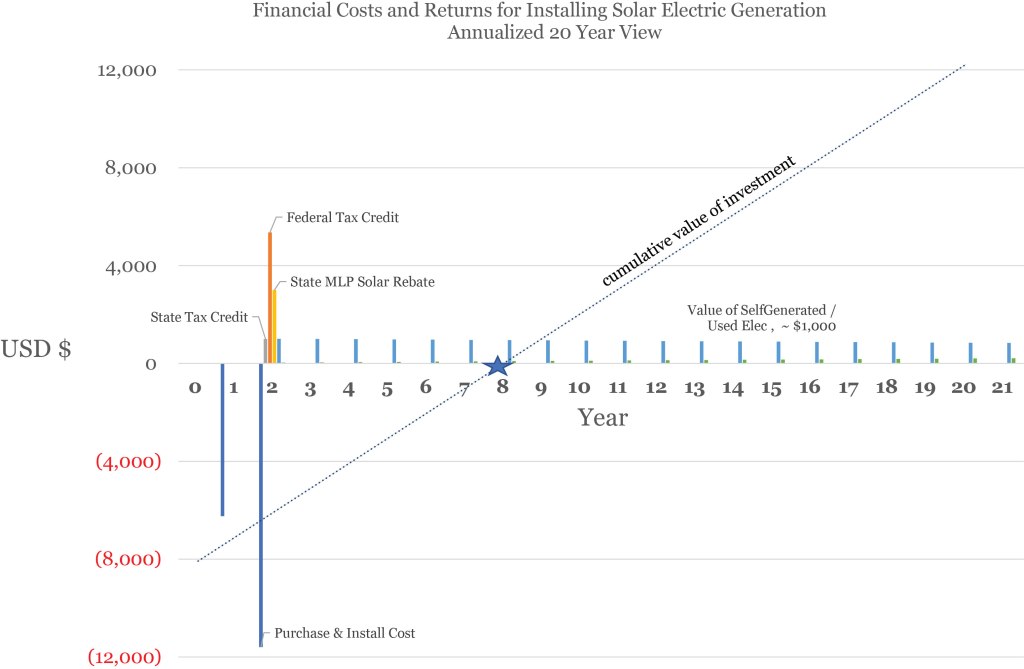
Assuming a 20 year life (and the life will be longer) the value at outset of installing this — the net present value — is almost $8,500. We assumed that demand for electricity remained unchanged at 5,500 KWhs per year and thence our annual electricity savings would remain the same at about $1,000 per year.
Here’s a graphic showing cumulating benefits and breakeven over time:
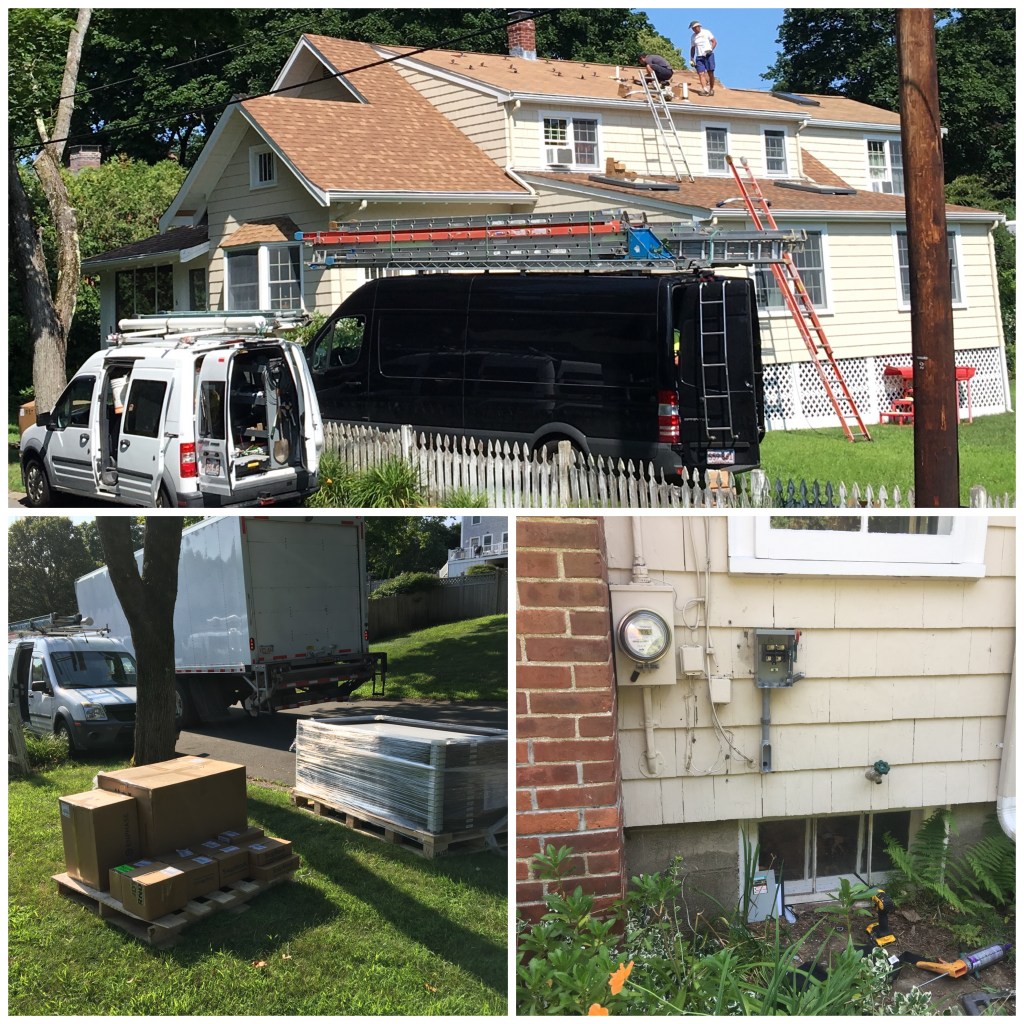
How Did the Installation Go?
The Installation went very well and very quickly. They installed and connected everything in one day.
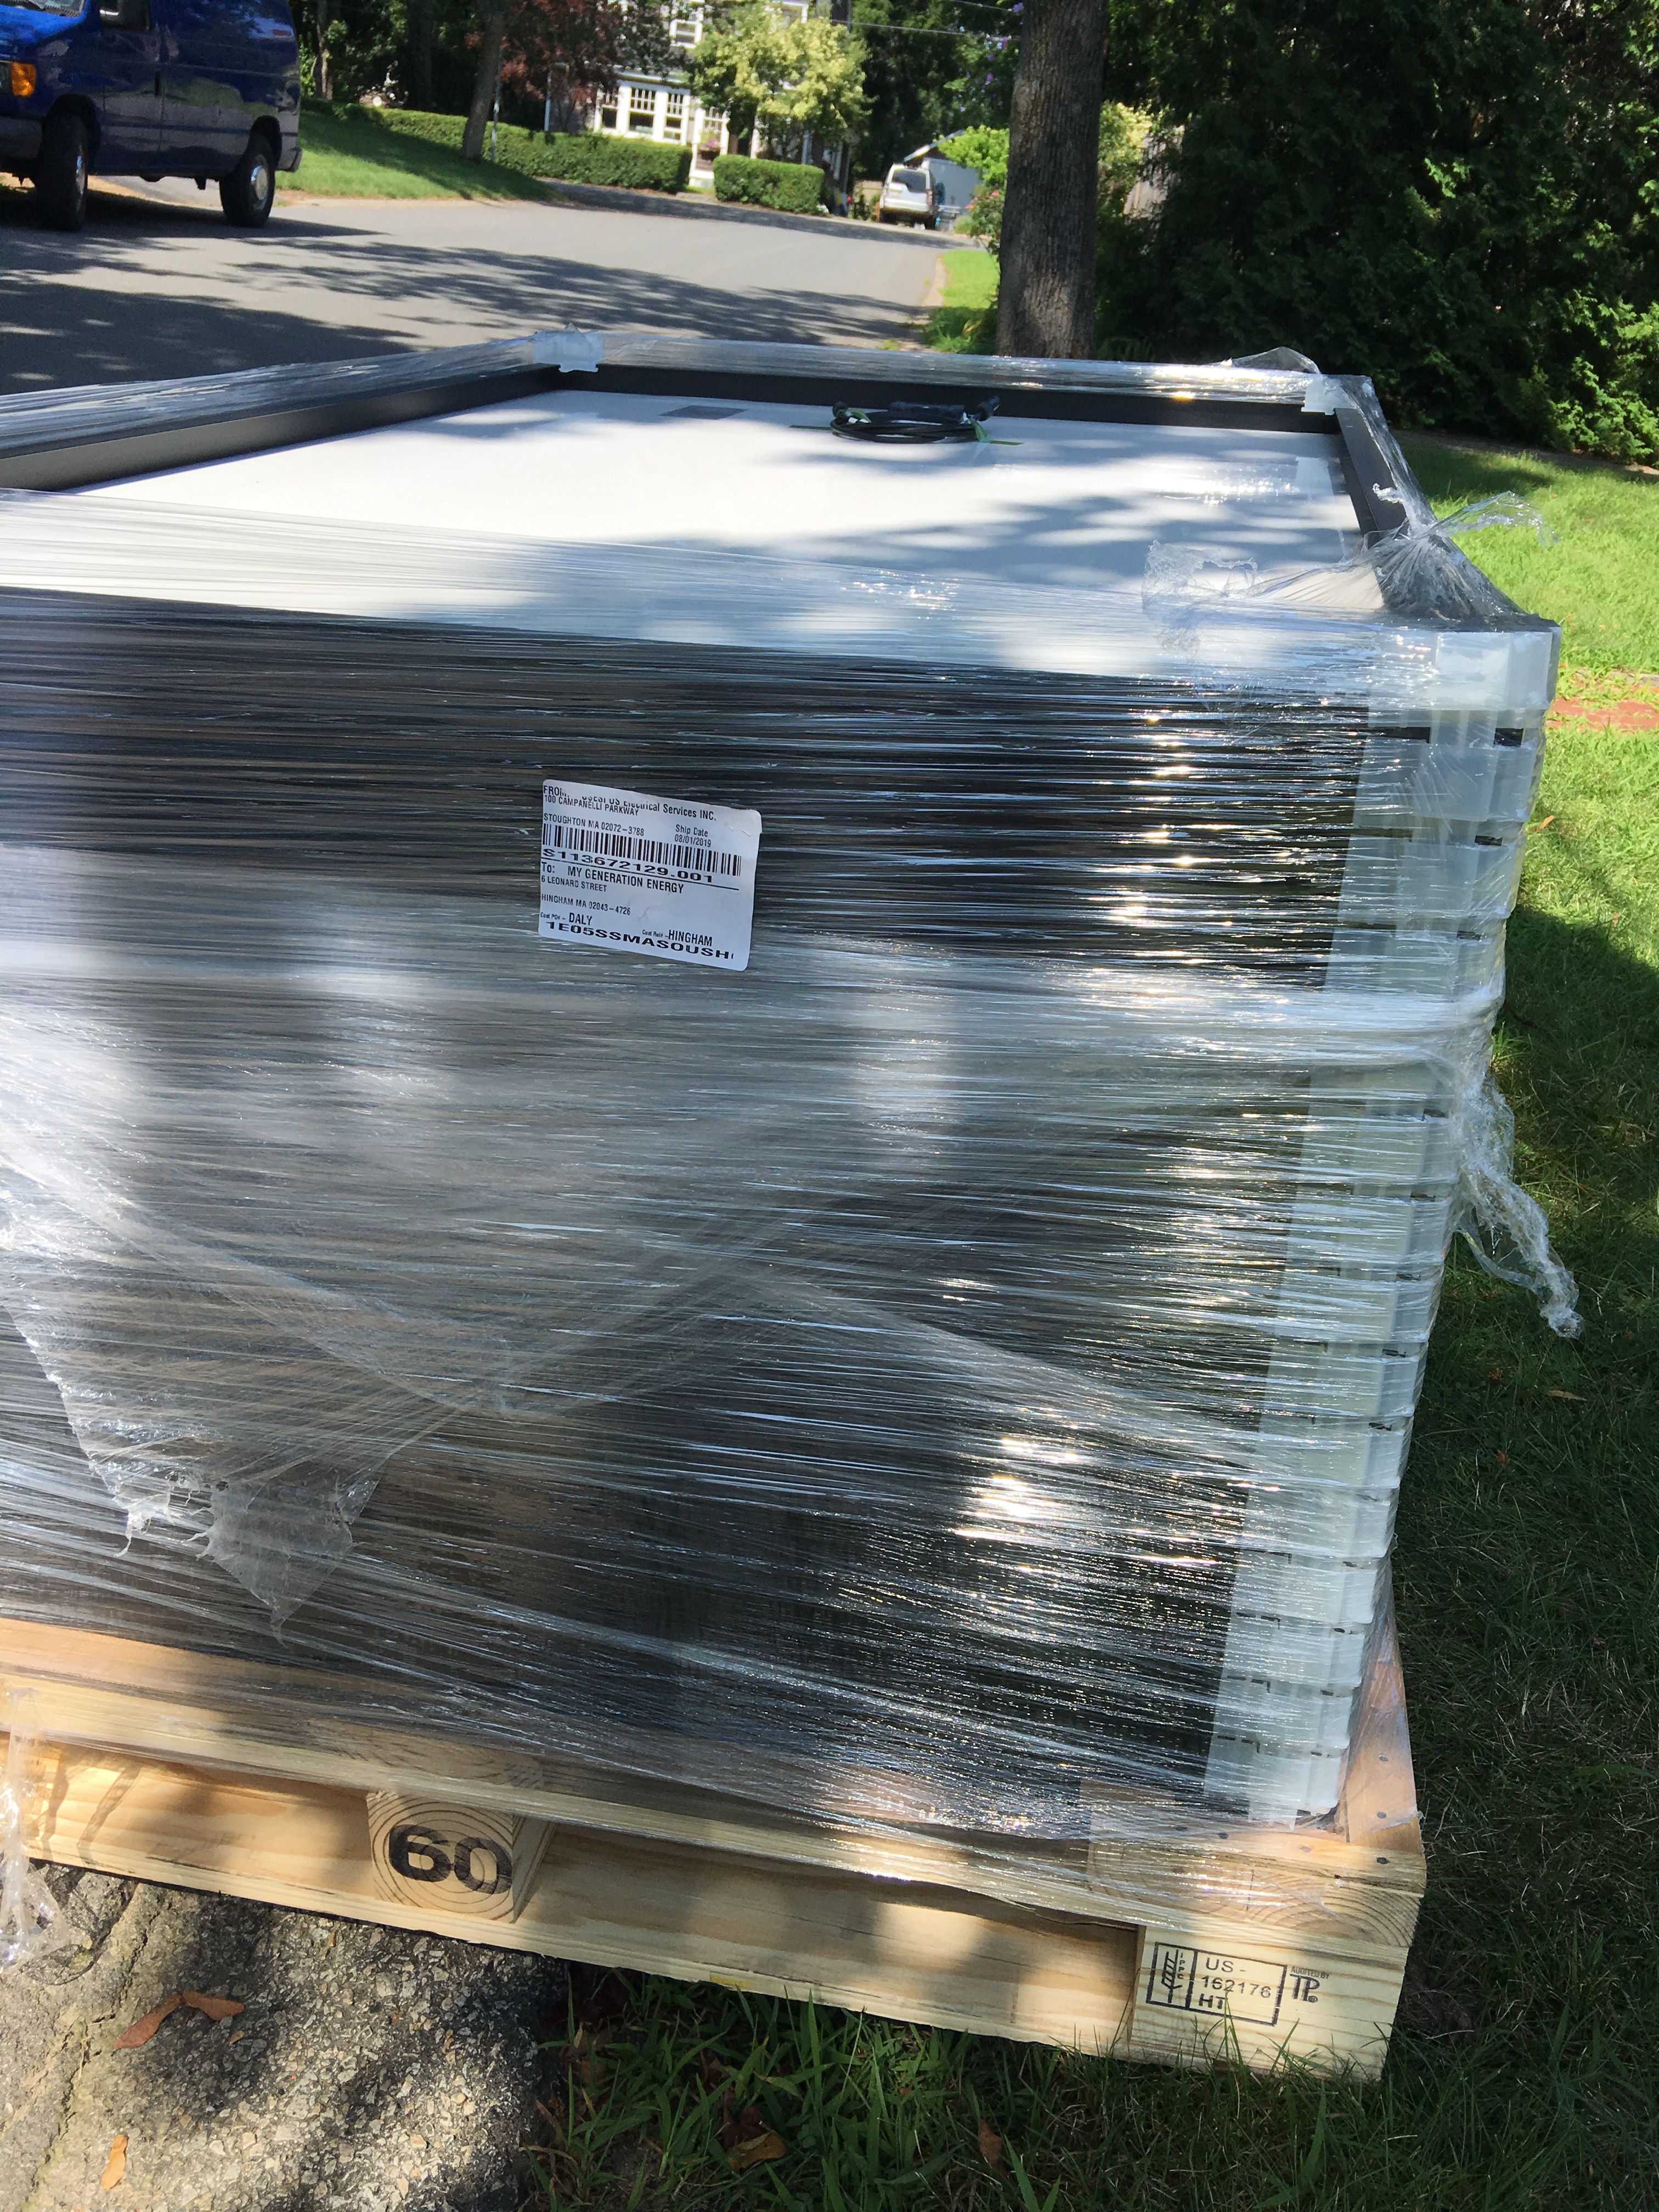
Panel and Equipment Delivery:

Roof Racks Installation:

Installing the Panels:
Wiring – through the roof …
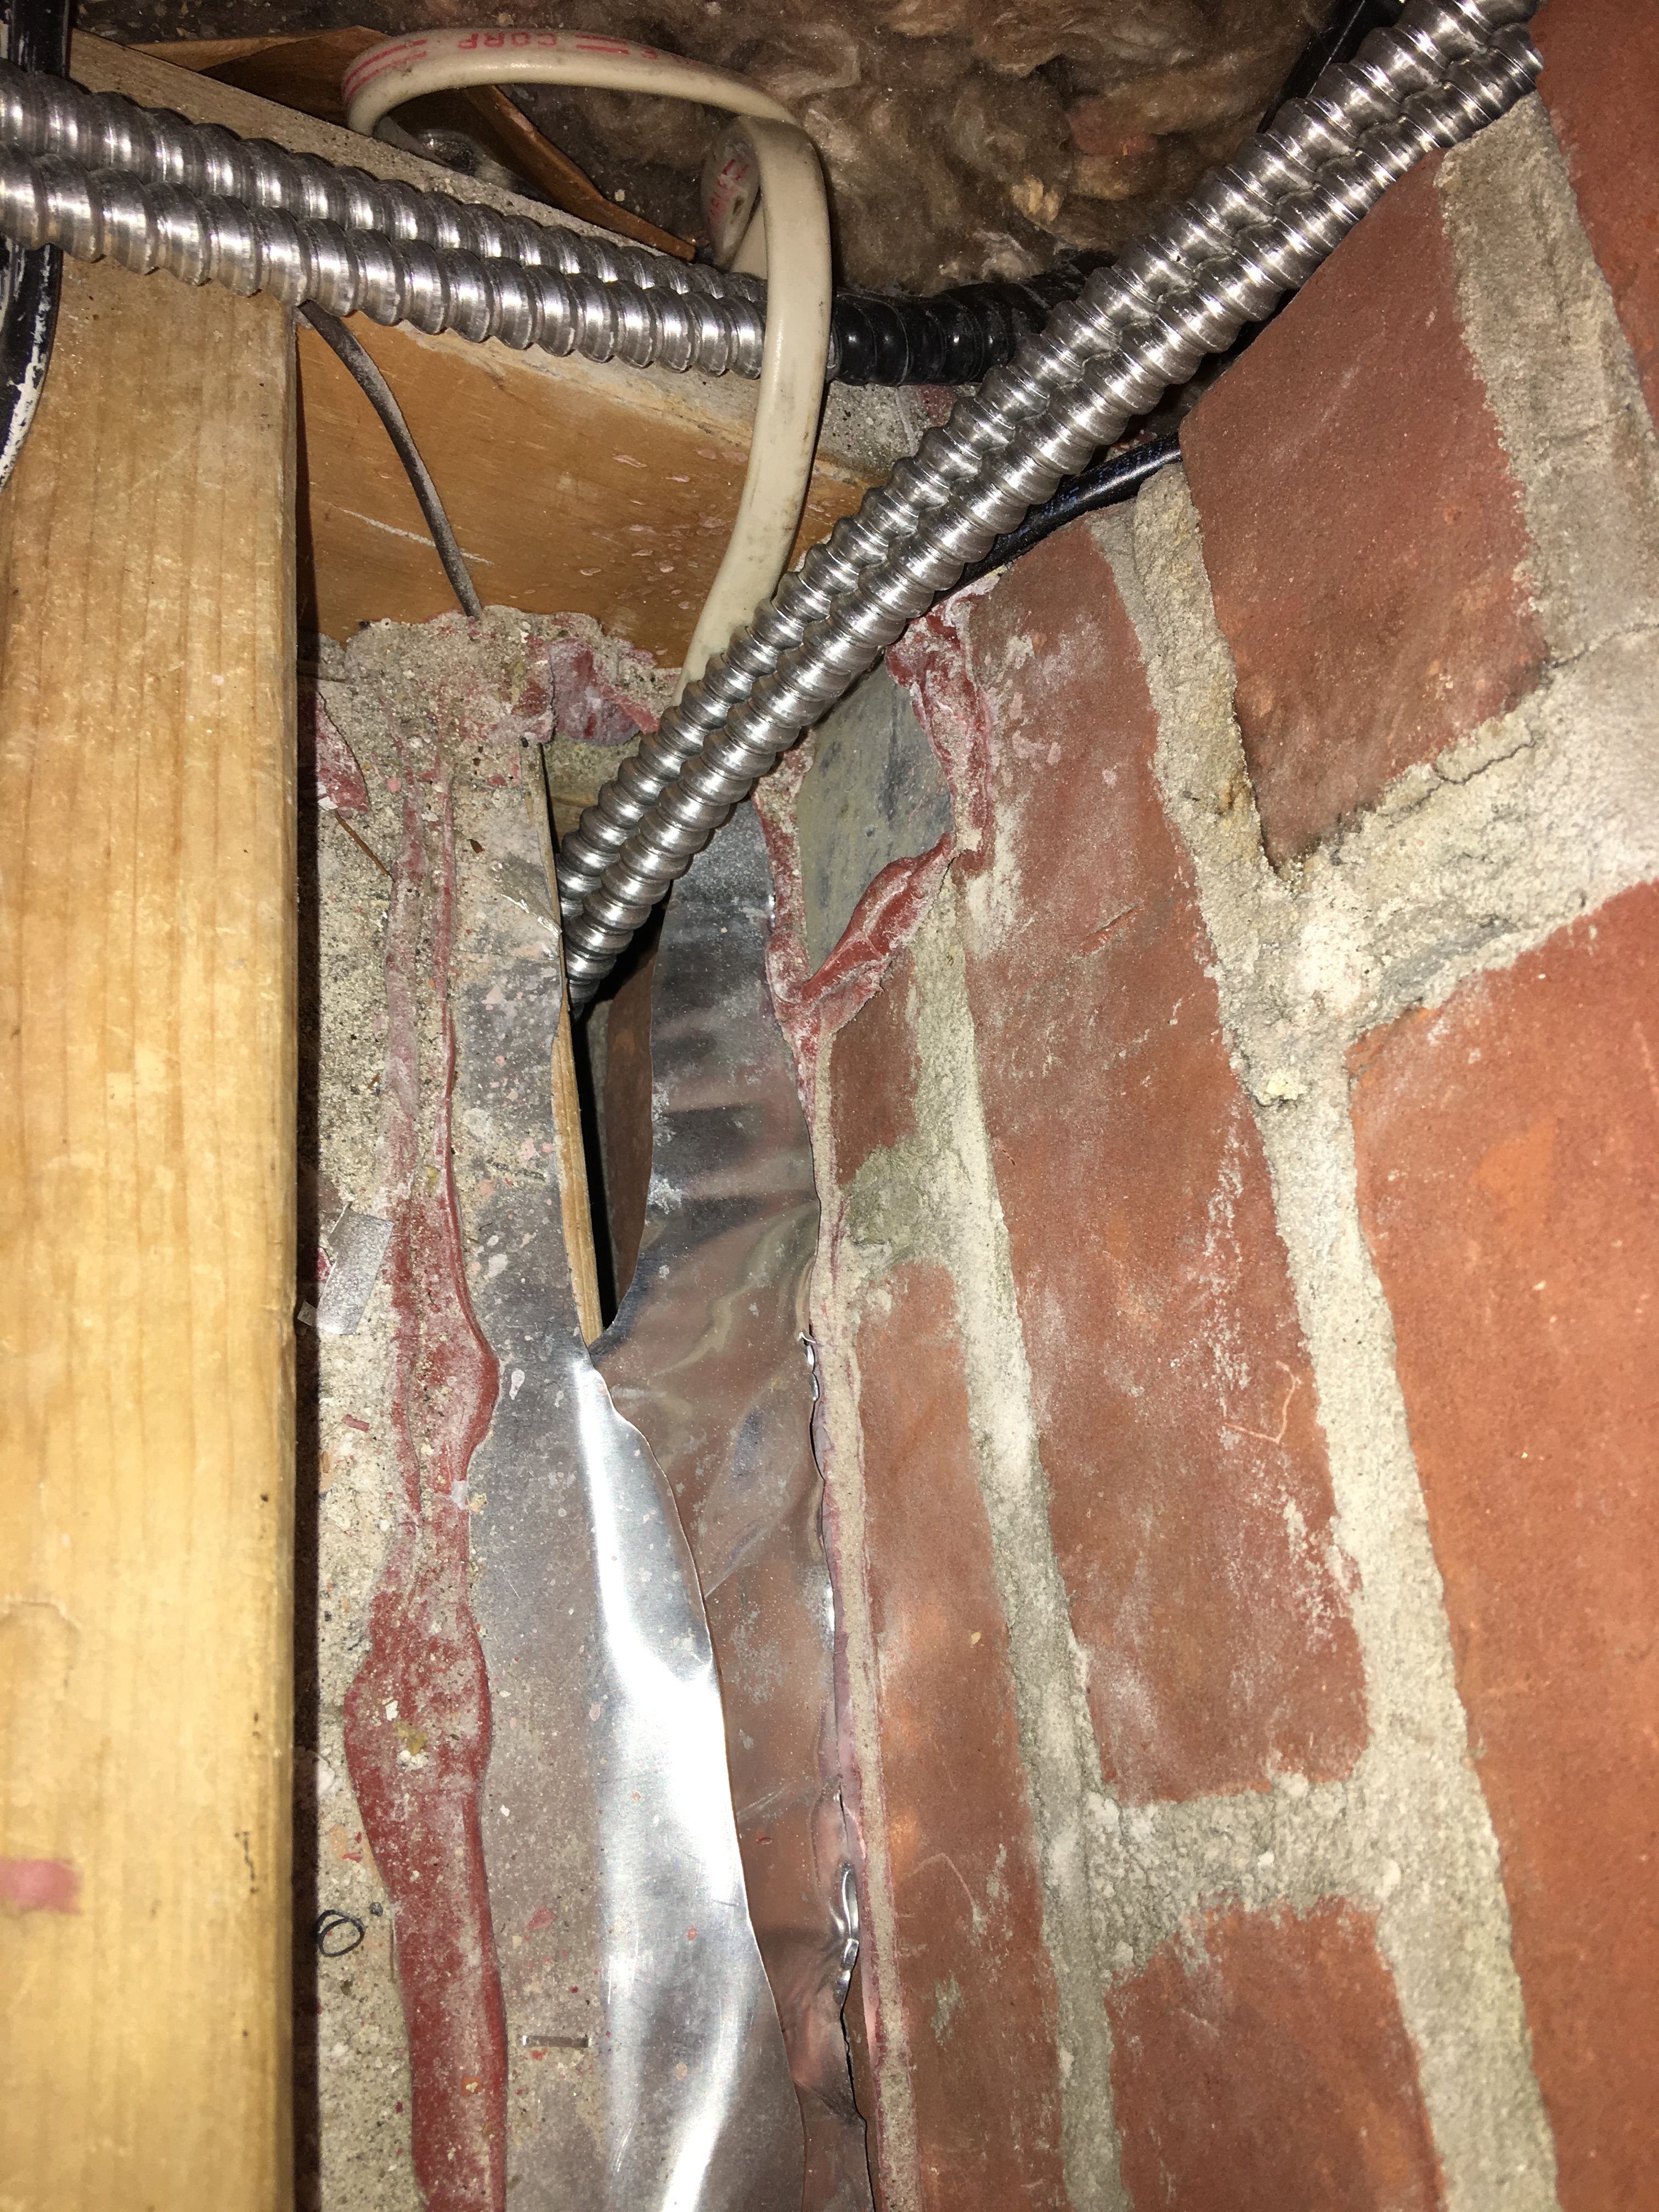
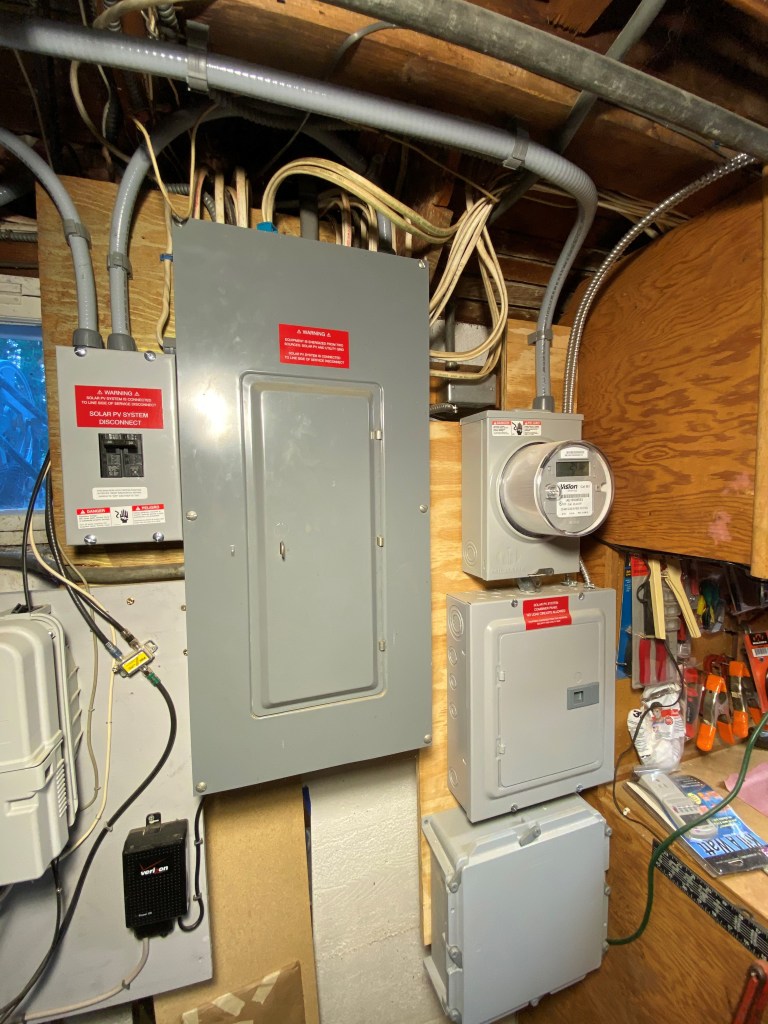
…and down to the new solar electric junction box tied into the main board in the cellar.
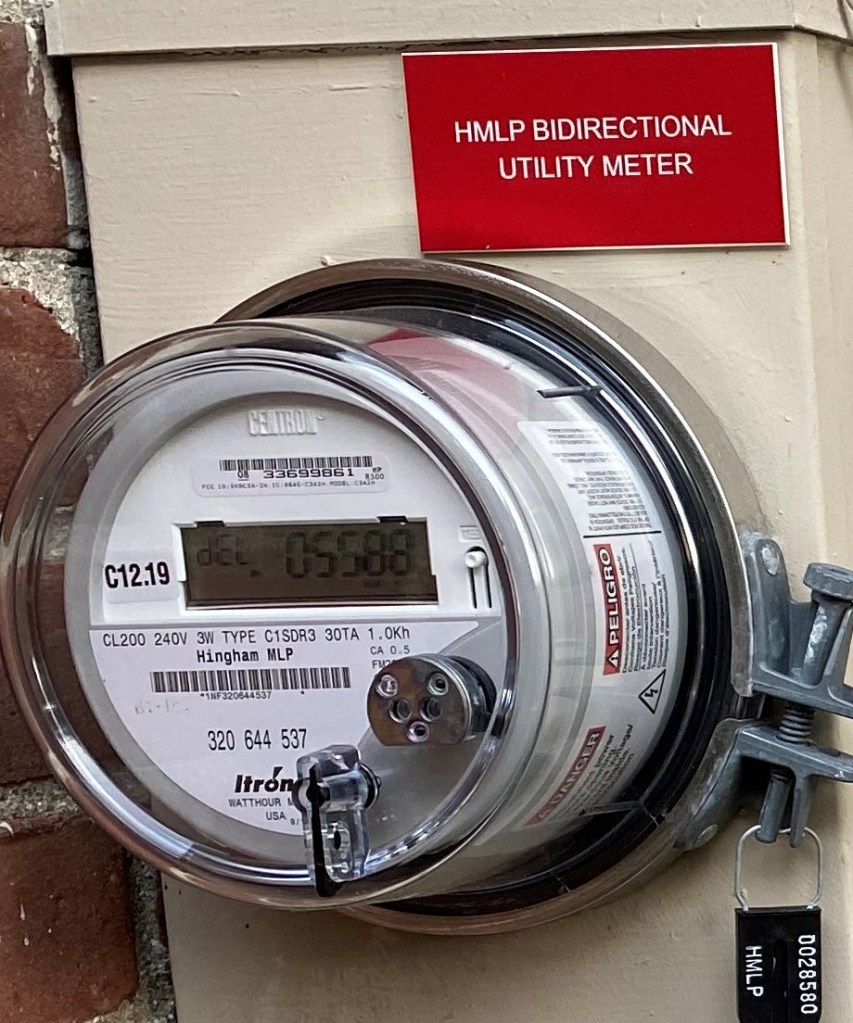
And the all important net meter on the outside:
Ready for inspection and testing, which we scheduled with HMLP.
Once we passed inspection HMLP turned us on and the overseeing HMLP technician said, “Last month’s bill is the last one you will ever owe us for!”.
And How Is It Going?
We have been collecting and using solar electricity now for over a year and can ascertain how much electricity we generate and use. A few tools allow this:
On the one hand the Enphase on line tracker tool shows us all our production in detail. This view shows that we have generated over 5,900 KWh for the 12 months ending on October 19 2020 and we are actually producing more than originally estimated:
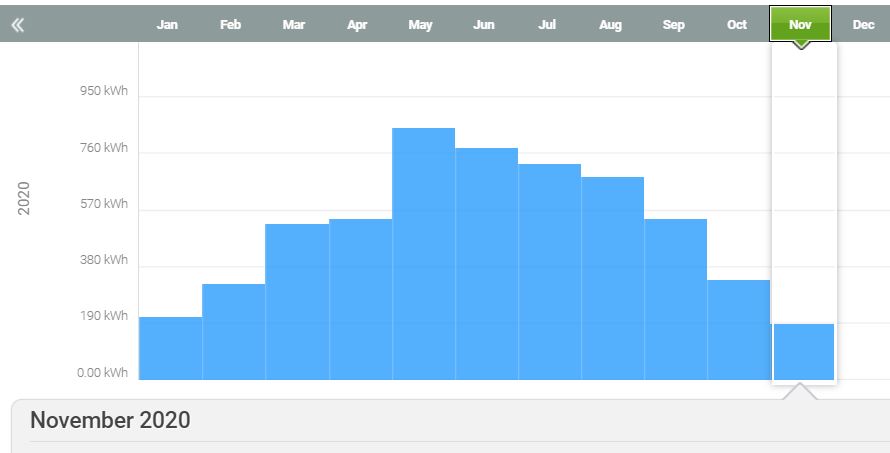
Source: Enphase Energy Company’s My Enlighten website using data from our Enphase Microinverters
Also, HMLP meters track our energy usage and solar production reporting on the amount of solar KWh produced, the amount of KWh used by the home and the excess KWh fed back to HMLP during periods when we overproduced. This chart showing that HMLP data reveals that in fact our usage of KWh has exceeded original estimates – hotter weather, more air conditioning and fans during July and August, etc. This chart shows our electricity usage in the months preceding solar generation (August, 2019) and our use and generation after solar turned on:
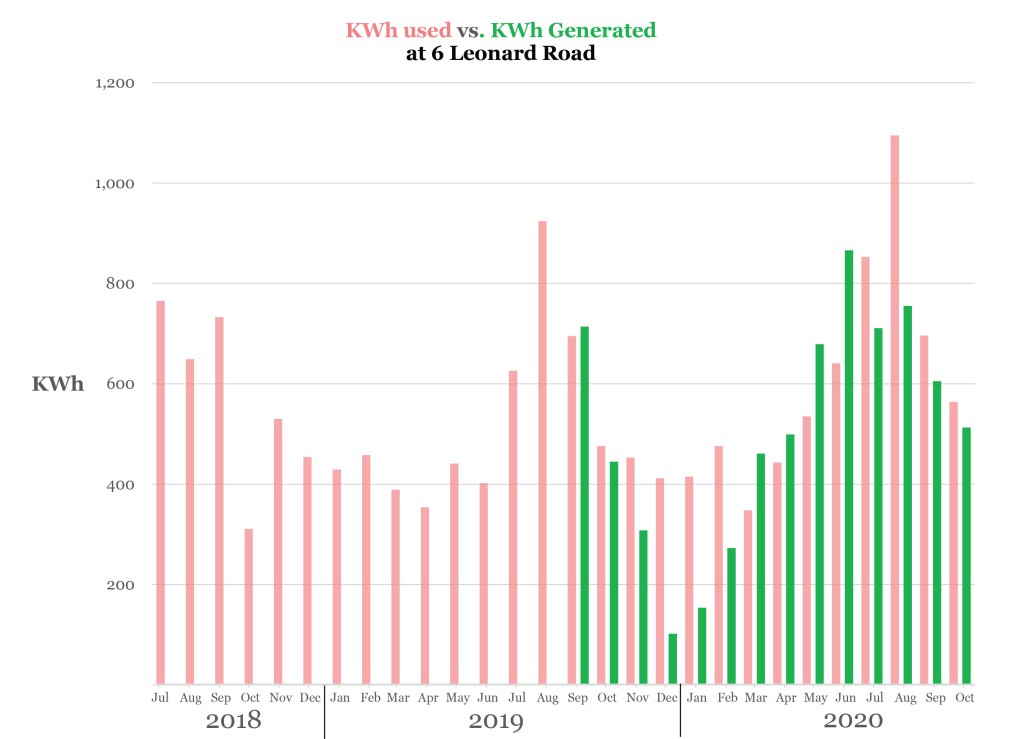
Note that we peak usage in July and August and those peaks rose from 2019 to 2020. Also in those months our use exceeded our production. Note starkly reduced solar production in December and January due to our northern latitude. Note also that in March, April, May and June our solar output exceeds our usage. From July 2019 to July 2020 we used 6,842 KWh while we generated 5,967 KWh, an 875 KWh shortfall.
As it turns out our arrangement of $5,000 credit with HMLP covers the cost of that 875 KWh shortfall, but the experience shows us that electricity demand does change and we might have to add more panels once our $5,000 credit runs out in 10 years or so.
But we are thrilled with the results, the reduction in carbon to the atmosphere and the whole idea of producing our electricity from abundant sunlight.